5 VIsUaLiZe with ggplot2
The simple graph has brought more information to the data analyst’s mind than any other device.

Self-Description xkcd 688
5.1 ggplot2
ggplot2 is a system for declaratively creating graphics, based on The Grammar of Graphics. You provide the data, tell ggplot2 how to map variables to aesthetics, what graphical primitives to use, and it takes care of the details.n
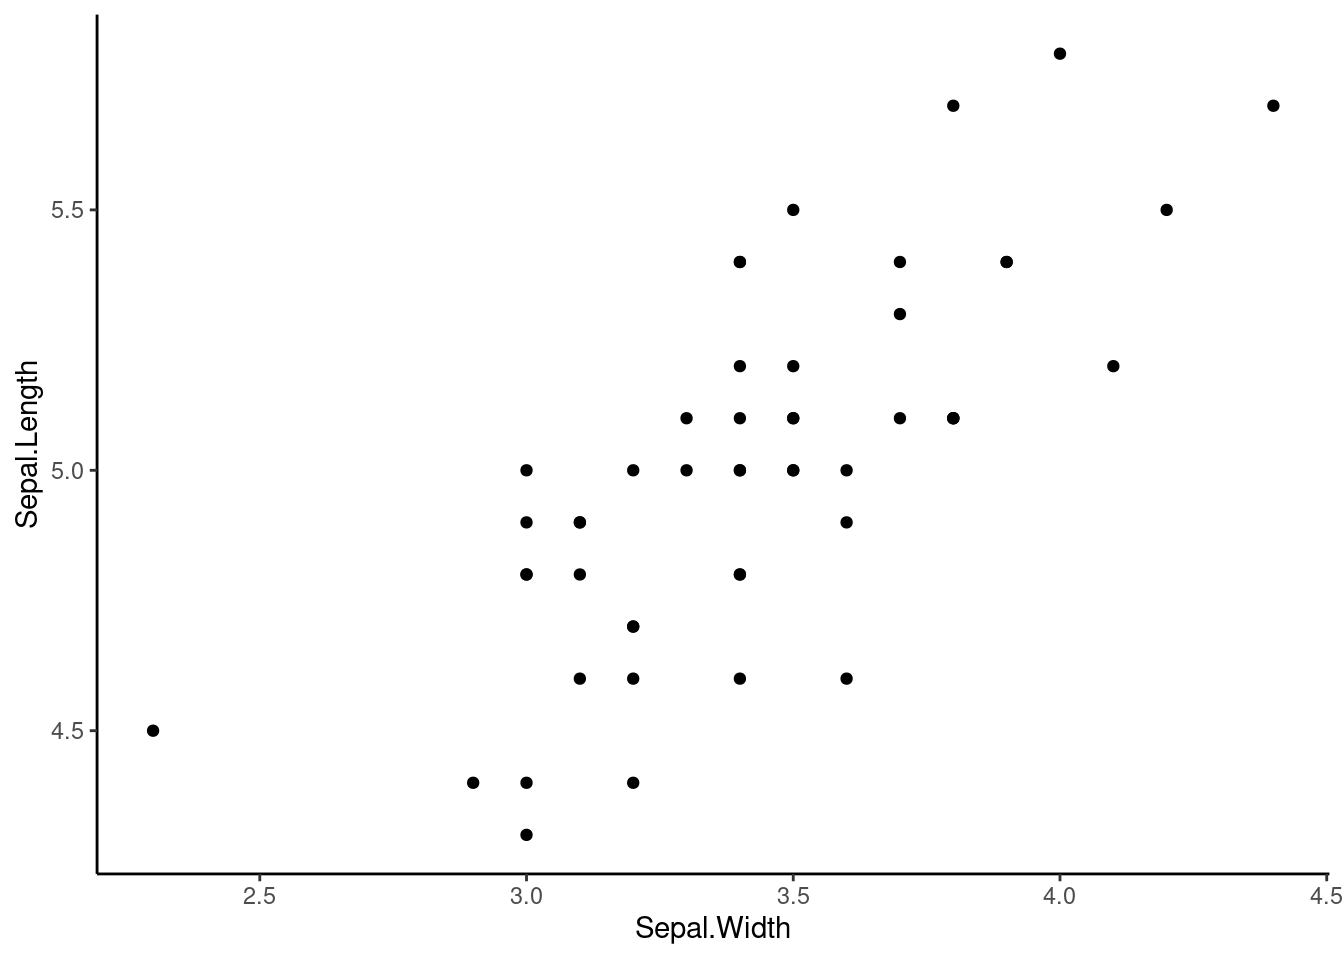
It looks something like this-
library(tidyverse)

iris %>%
  filter(Species == "setosa") %>%
  ggplot(aes(x = Sepal.Width, y = Sepal.Length)) +
  geom_point() +
  theme_classic()